CRASHRHINOCEROS
SOFTWARE · GAMES · EXPERIMENTS · OLD WEB

I’ve been making things with computers for a very long time.

When I was a kid, I taught myself to code on an Apple ][+. I started by reading other people’s programs, changing them, breaking them, and figuring out why they worked. I’m still doing essentially the same thing.

WHERE IT STARTED

Sixty-four pages of Oregon Trail source code.

Christmas of 1979. Dad came home with a used Apple ][+. (How he got it, entirely legally, is entirely another story.) It was the whole shebang: The computer, a 9-inch black-and-white monitor, two floppy drives, an Epson MX-80 printer, and a big box of tractor-feed paper.

I'd already had experience with Apple computers from school. Dad also bought me a few games: Gorgon, Bug Attack, and Hadron. I played the hell out of them (especially Hadron). Before long, friends with similar computers and I were... talking all about and sharing stories of our games. Yeah. Talking.

One day a friend showed me how to look at source code. He goes “Watch this”, and types LIST after I'd loaded Oregon Trail. 64 pages of Applesoft BASIC flooded the screen. It went by too fast to read. So I printed it. All 64 pages.

And I began to read it.

One night, some time after I had gone to bed, Dad peeked into my room and found me with a flashlight in hand and a long trail of tractor-feed paper all over the floor.

“What do you think you’re doing?” he asked.

“Reading.”

Then he looked closer at what I was actually reading.

“Just what in Sam-Hell are you reading?”

He was very fond of that odd “Sam-Hell” saying.

I showed him: I was reading the source code to Oregon Trail. And I was learning a lot.

There was no reprimand for staying up past bedtime. Dad just gave me a rather odd look, said, “Okay ... you keep reading there,” and quietly left.

As time went on, I printed out the source code to nearly every Applesoft and Integer BASIC program I could find, and tried to understand what every line did. I modified stuff. I broke stuff. I fixed stuff. In 1980 there were not a lot of programming books aimed at a curious nine-year-old, so the Applesoft BASIC manual that came with the computer—and other people's source code—became my curriculum.

I wasted a lot of tractor-feed paper. Fortunately Dad bought it by the box for his office, and the ribbon cartridge in that Epson MX-80 seemed to last for years.

Within a year or so I had written my first little adventure game. A year after that came Kill The Tank, an artillery-style game that other kids at school actually wanted copies of. I started messing with PEEKs and POKEs, built a crude form of copy protection into Applesoft BASIC, pushed Kill The Tank toward something more like a first-person arcade game, and started work on a player-editable dungeon.

Much later I dabbled in Pascal, Ada, C and assorted scripting languages, but JavaScript turned out to fit the way I liked to work: almost no setup, no proprietary SDK, and ideas could be tested immediately. For a while, most of that experimenting happened on the ferry to and from work.

That’s literally how I learned to code: by taking things apart until I understood enough to build my own.

THE THINGS I BUILT

Useful. Ridiculous. Sometimes both.

Some of these solved real problems. Some were experiments. Some existed because the thing I wanted didn’t exist yet.

WORLD BUILDING · PURE JAVASCRIPT
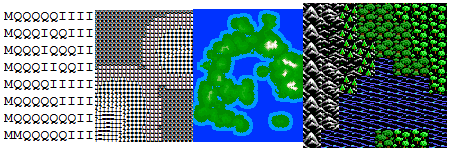
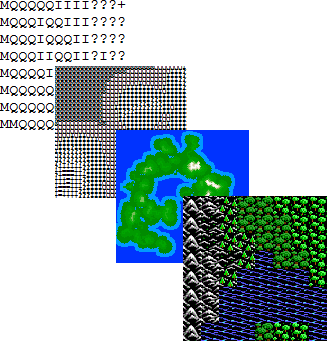
RhinoBuilder progression

RhinoBuilder

I needed believable worlds for a game and discovered I was terrible at drawing them. I tried hand-built text maps, then color-coded images analyzed pixel by pixel. Eventually I realized I was solving the wrong problem: instead of building a better way to draw a world, I could build software that generated one.

RhinoBuilder 1

The proof of concept. The interface was crude, but the important thing happened: the browser could generate the world instead of making me draw it.

RhinoBuilder 1 development artifactOpen RhinoBuilder 1 →

RhinoBuilder 2

The idea became a real tool: a much better interface and substantially more sophisticated procedural world logic.

RhinoBuilder 2 interfaceOpen RhinoBuilder 2 →

RhinoBuilder 3 is in progress.

GAME DEVELOPMENT · PURE JAVASCRIPT
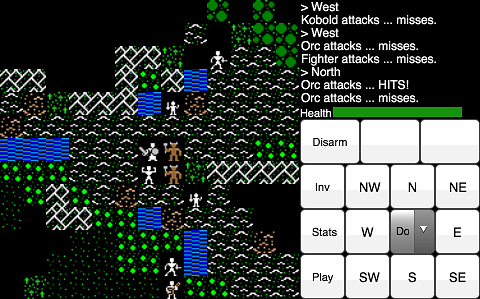
Treason combat scene

Treason

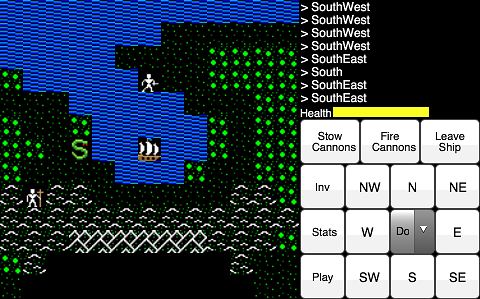
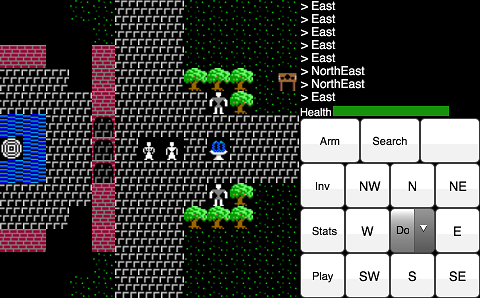
An old-school adventure/RPG engineered to run smoothly on an iPhone 3G. No frameworks. Very little performance headroom. Maps, movement, combat, towns, ships, inventory, state and interfaces all had to cooperate on hardware that now seems prehistoric.

The technical piece I’m proudest of is the custom line-of-sight blocking system: a visibility approach I designed to be both accurate and computationally lean.

Treason ship in a coveTreason town scene
Play Treason →
UTILITY · RESTAURANT ANALYTICS

TipAssist

When tipping became ridiculous, I wrote software about it.

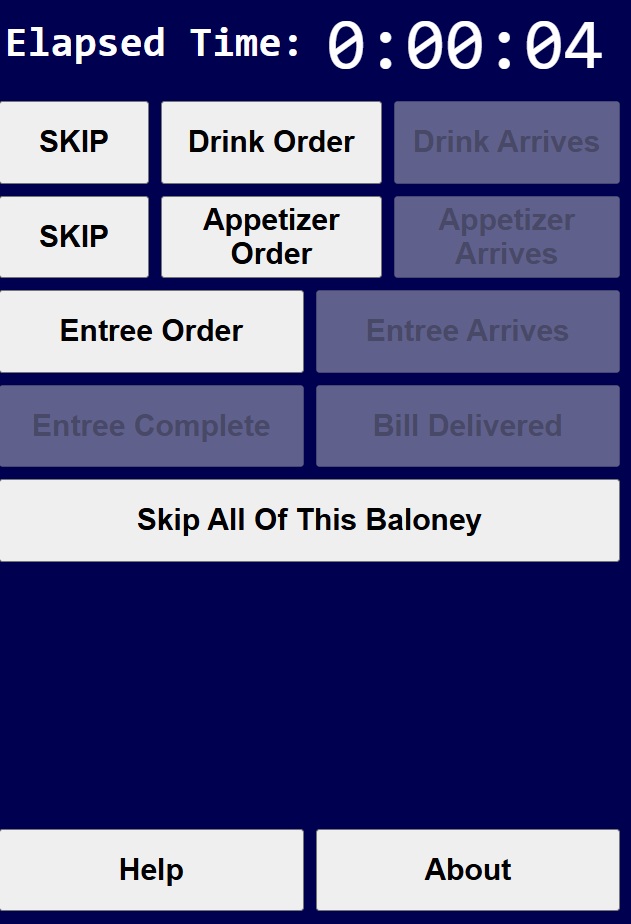
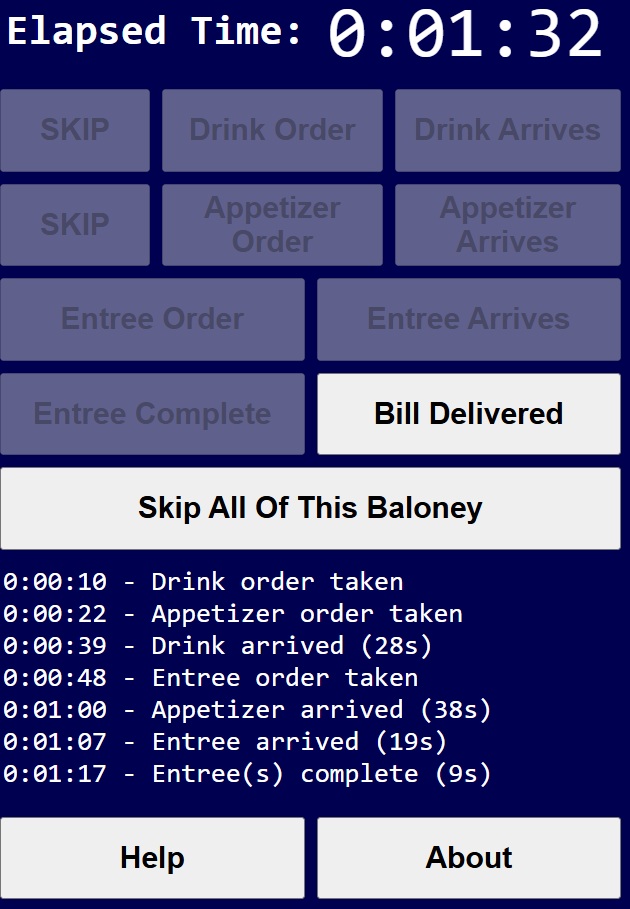
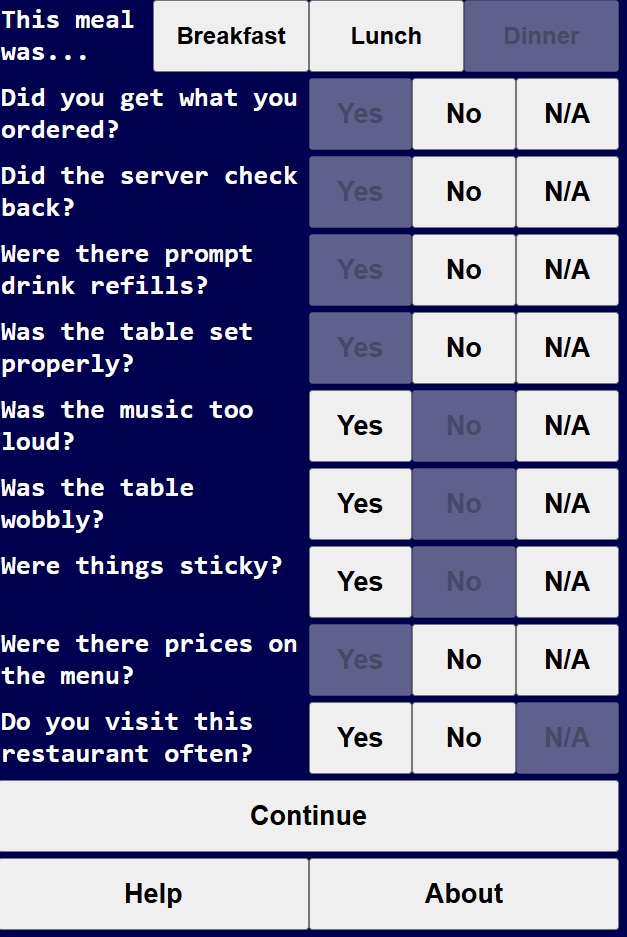
TipAssist timestamps the actual dining experience—drink order, arrival, appetizer, entrée, bill—and combines those timings with questions about the restaurant and service. Instead of simply suggesting a percentage, it applies an explicit scoring methodology.

TipAssist timing screenTipAssist meal event logTipAssist dining questionnaire

From the original About screen

“Way back in the “before-time,” a customary tip at a dining establishment was 15%... Then came 18%. Then 20%. Then 25%. Then take-out screens demanding tips. And diners have had enough.

Tip Assist is an objective dining tip assessment tool designed to help cure this diseased tipping scheme.

The original Help/Methodology screens explain that roughly half of the assessment comes from measured service timing and the other half from explicit experience questions and weighted penalties. Also: yes, the fictional corporate entity was Buttst, Inc.
Open the original iPhone-era app →
EXPERIMENT · 2012

TinyFont

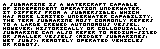
An experiment in making the smallest directly distinguishable alphanumeric font I could manage. The core characters live on a 3×3 grid and are rendered as graphics so they can be manipulated and printed at absurdly small physical sizes.

The important part is scale. So this image is shown at its actual original size:

TinyFont text at its original 160 by 49 pixel size
“A submarine is a watercraft capable of independent operation underwater. It differs from a submersible, which has more limited underwater capability. The term submarine most commonly refers to a large crewed autonomous vessel. However, historically or colloquially, submarine can also refer to medium-sized or smaller vessels (midget submarines), wet subs, remotely operated vehicles or robots.”

The inspiration came from staring at small bathroom floor tiles. An occasional occurrence.

Open TinyFont →
BIKES BY THE NUMBERS

I wanted to turn motorcycle classifieds into market intelligence.

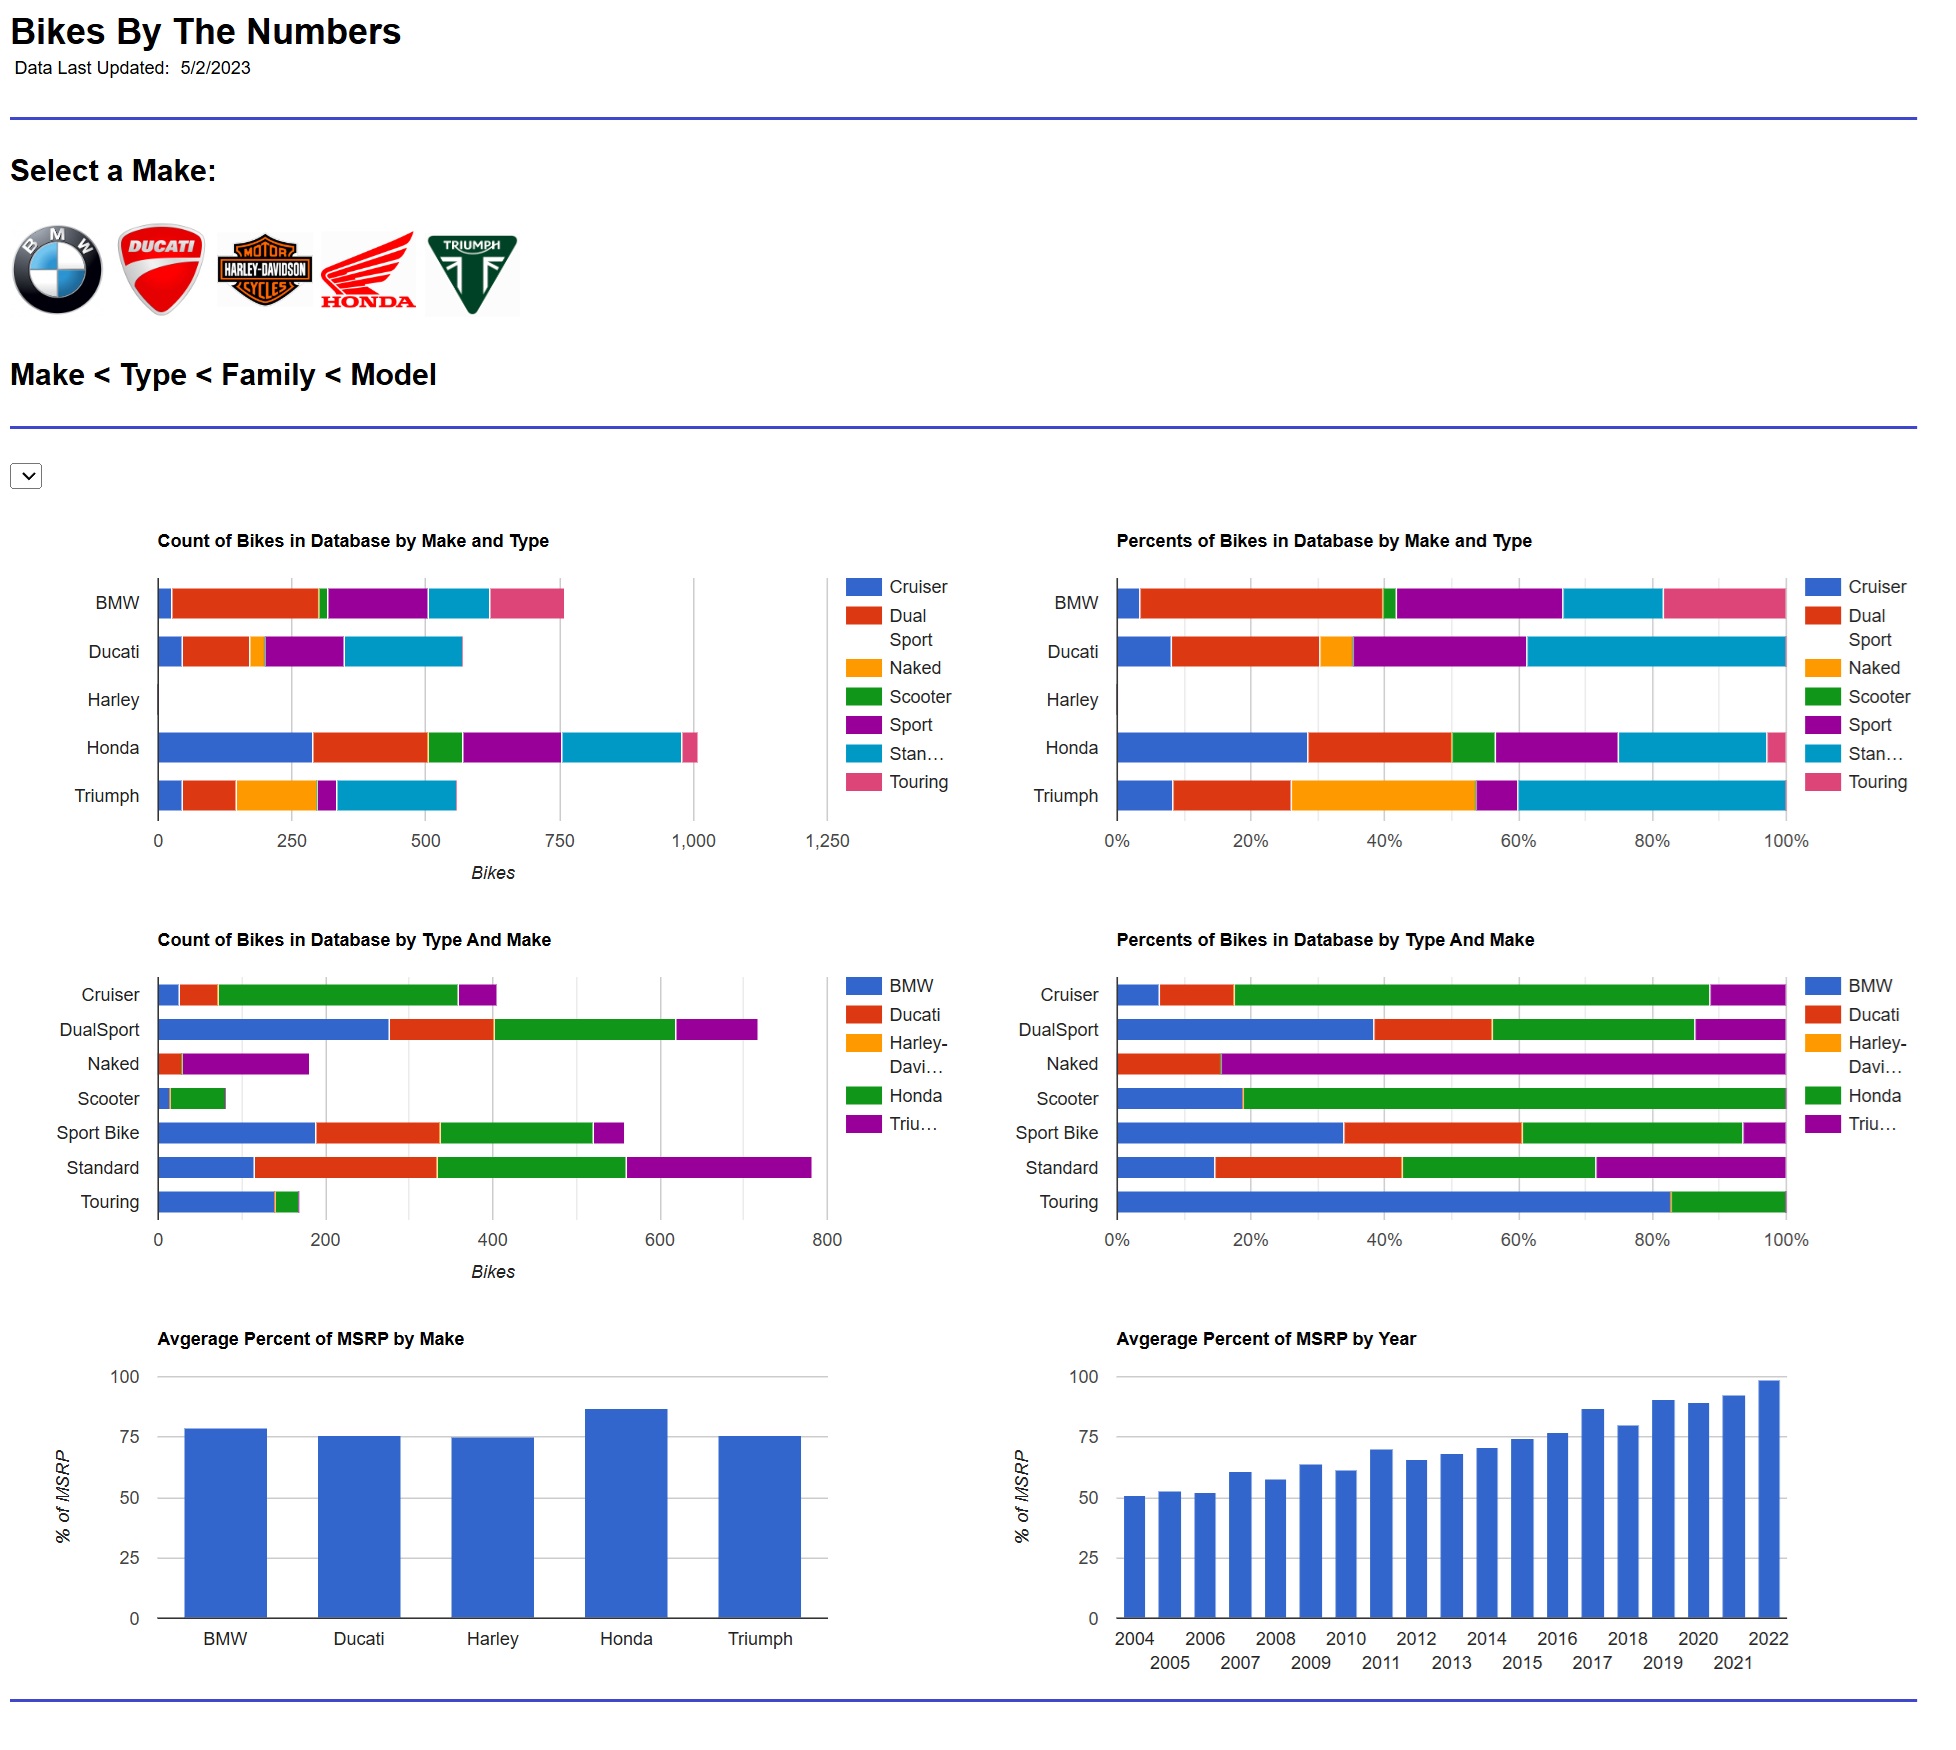
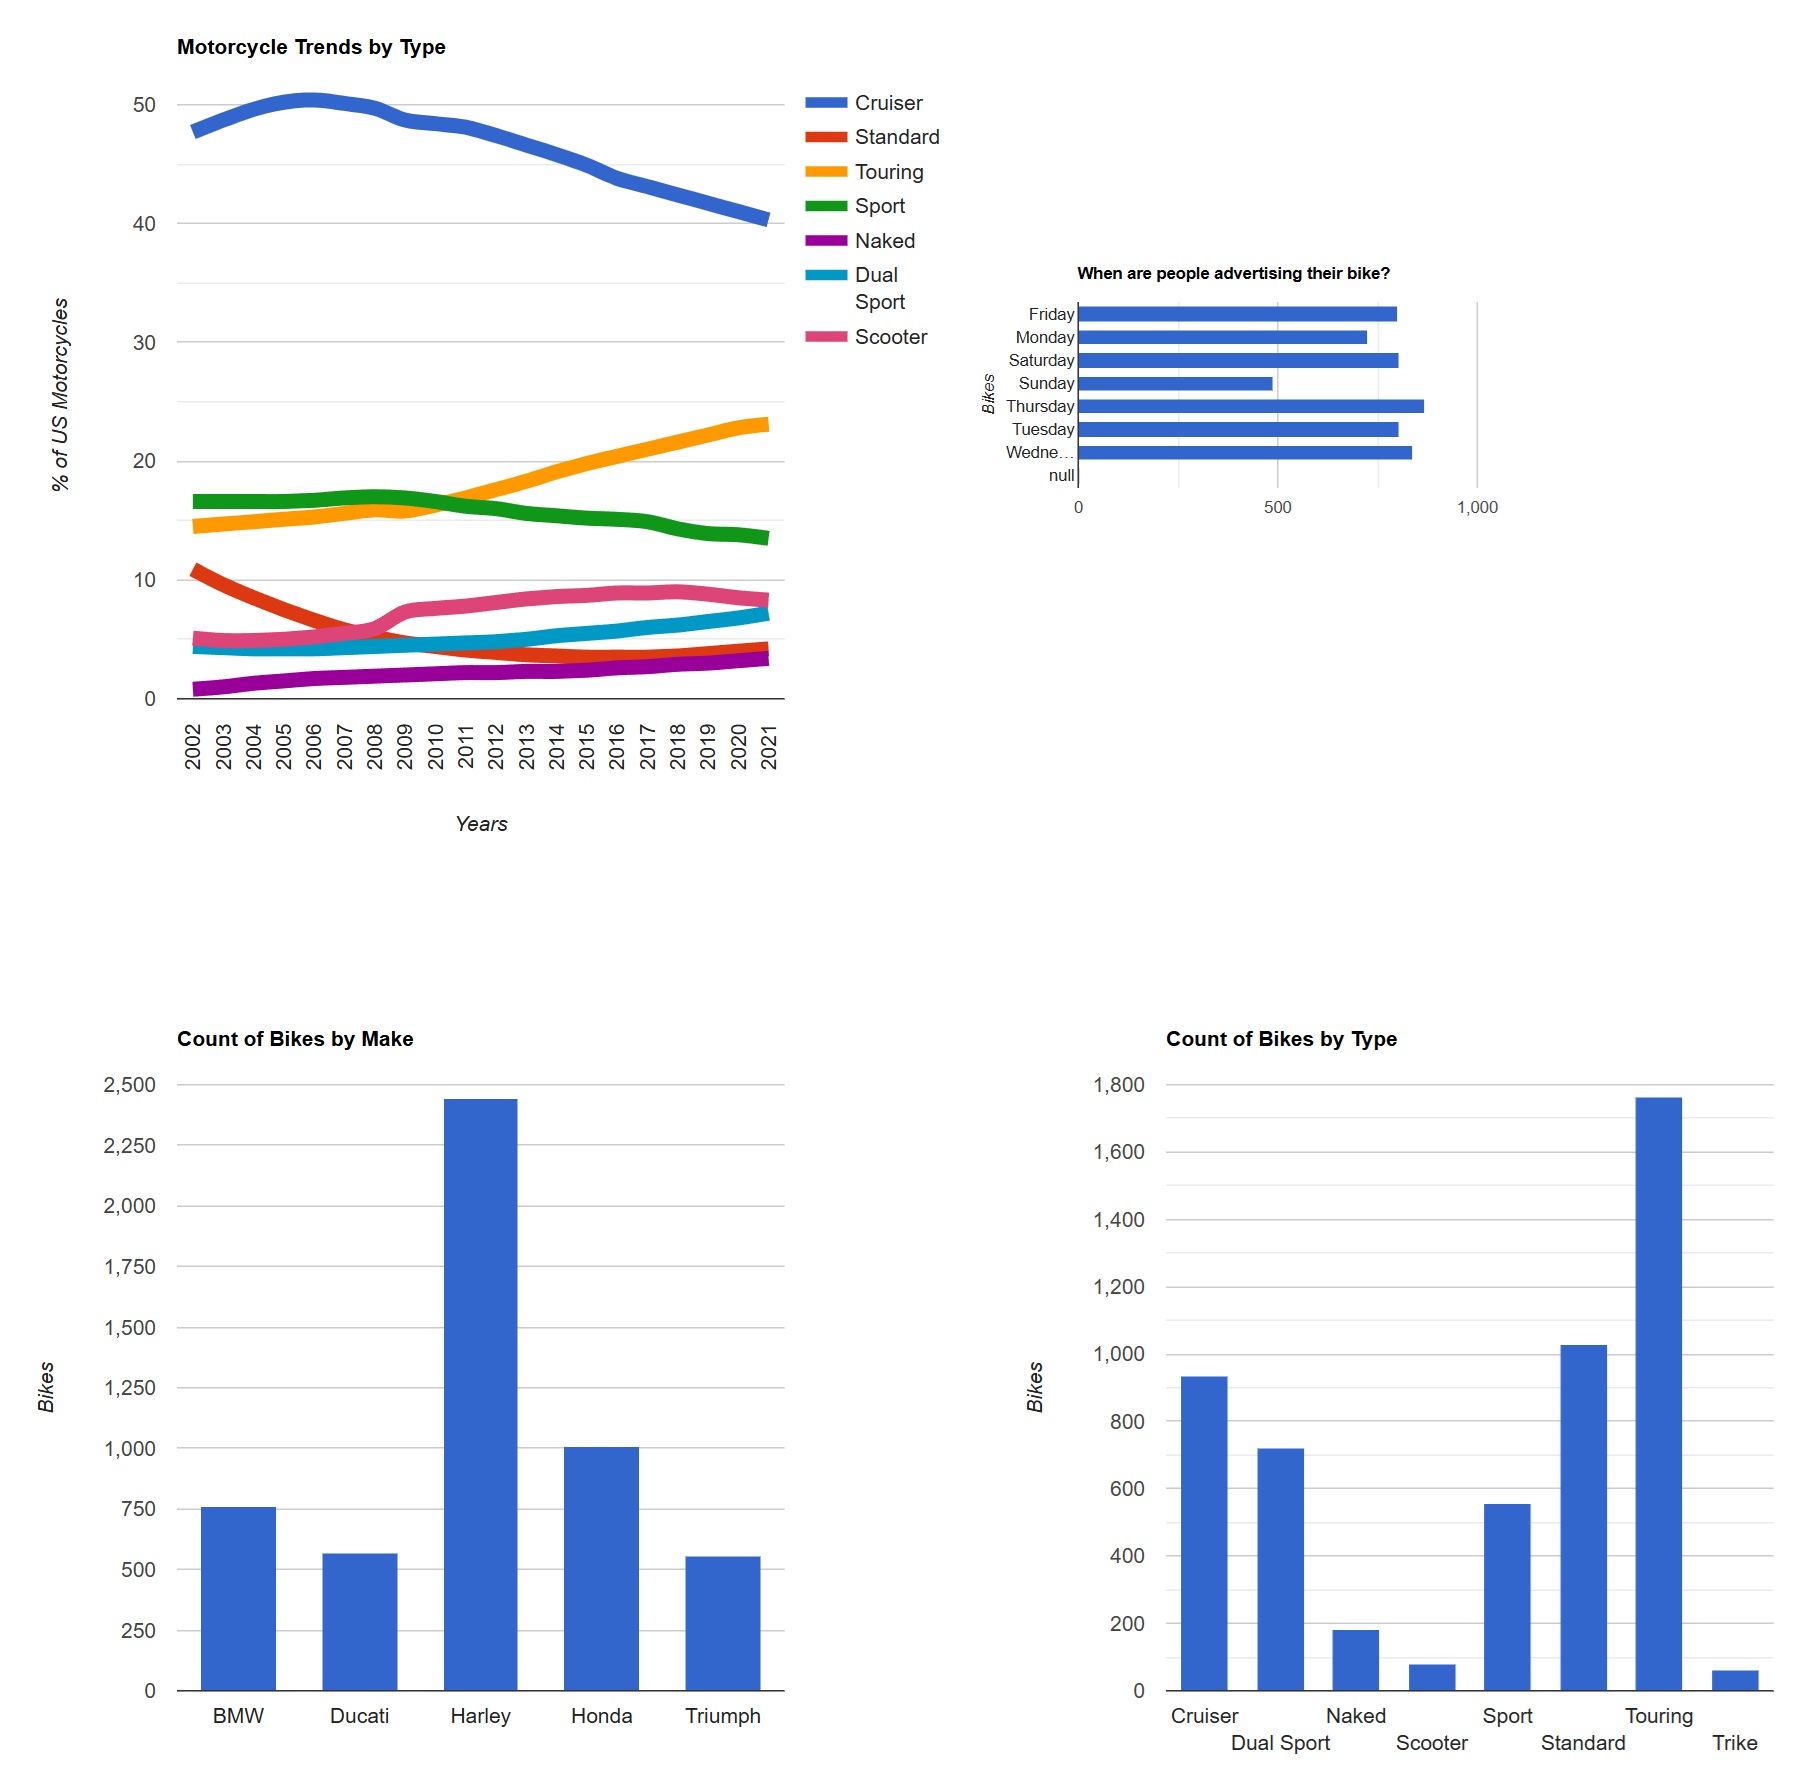
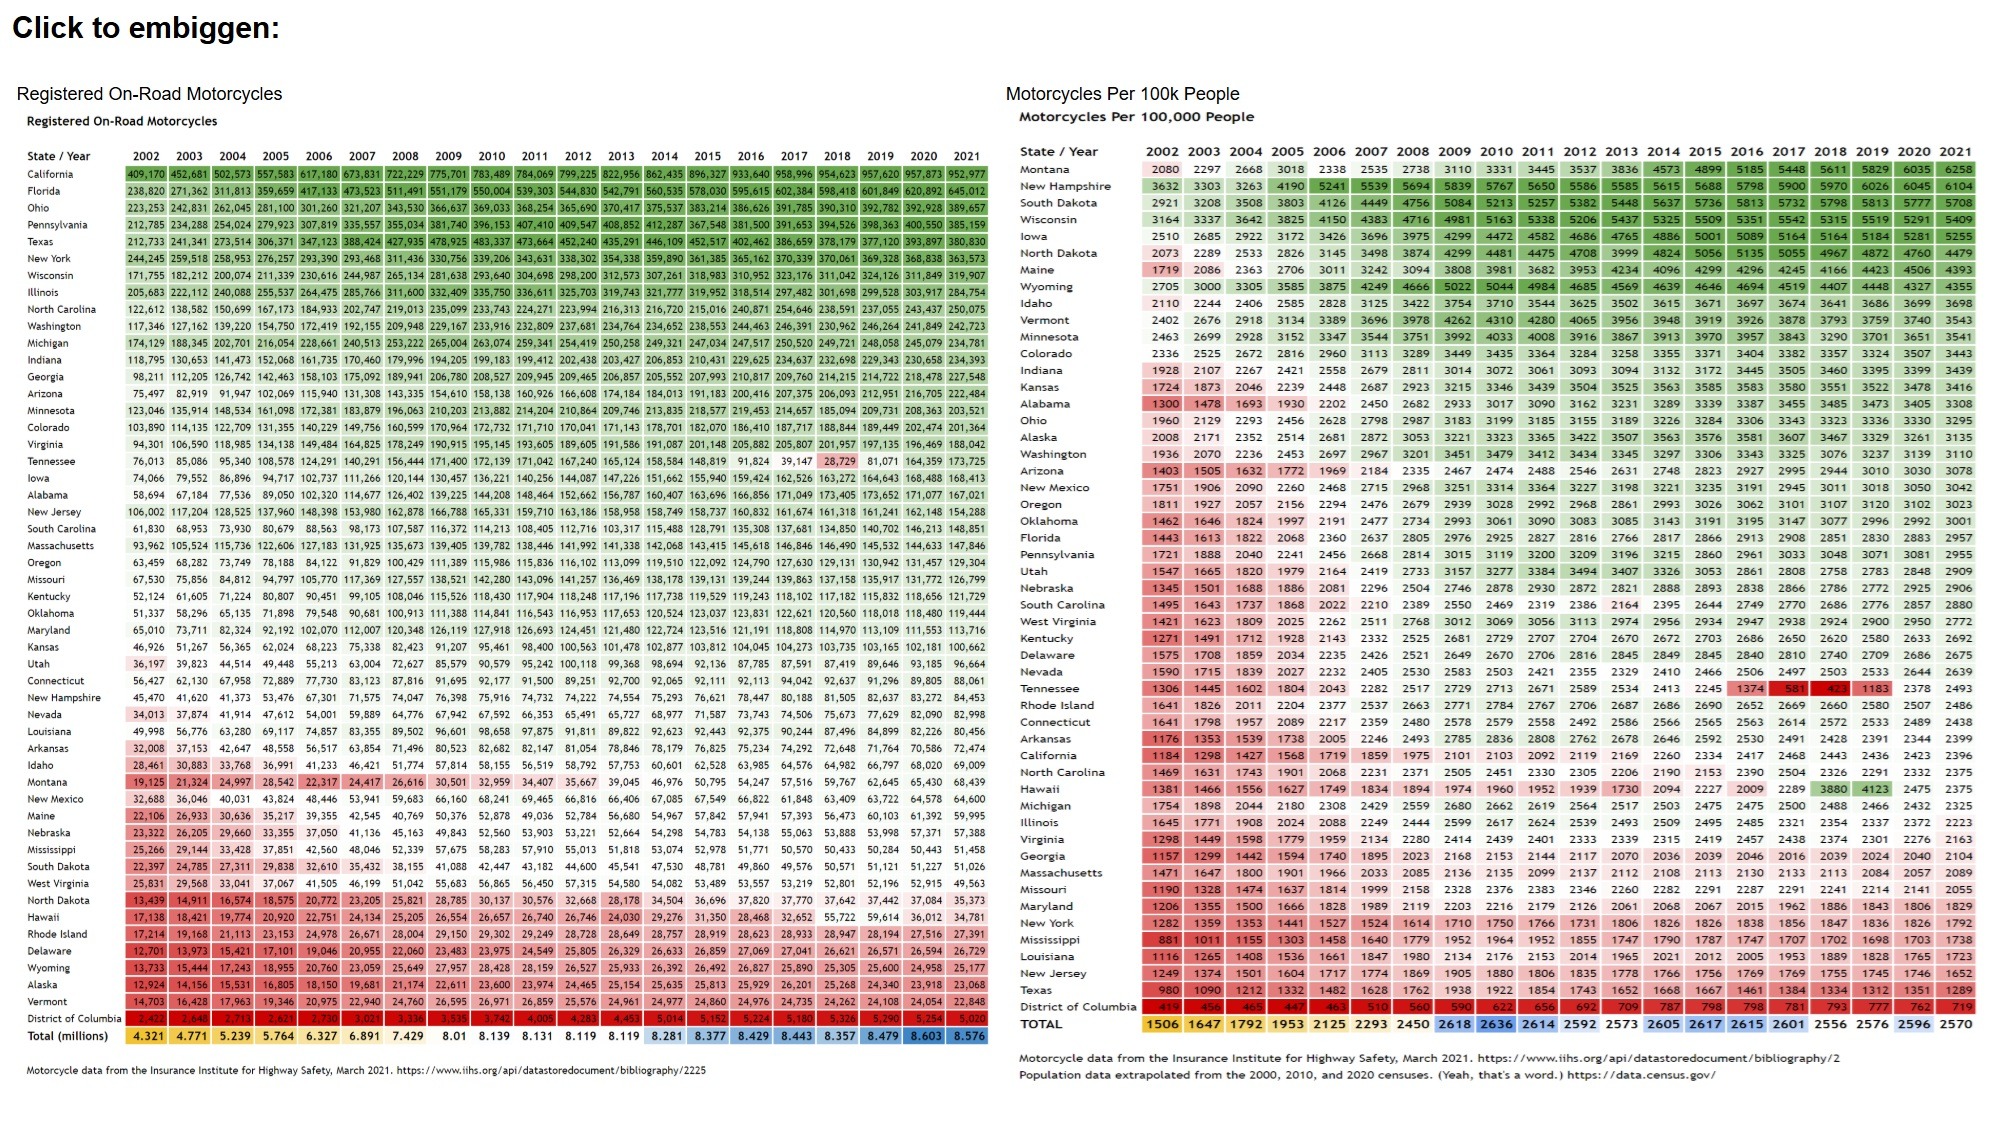
While I was between jobs, I started building a web application that would give motorcycle dealerships a much better view of the used-bike market around them: what was being advertised, which makes and models were common, how bikes were priced, how the mix was changing, and what the broader market looked like.

Bikes By The Numbers interactive motorcycle-market dashboard
Motorcycle type trends, listing day patterns and counts by make and type Motorcycle registrations by state and motorcycles per 100,000 people
AcquireCollect messy real-world motorcycle listing data from classifieds.
ParseExtract and normalize year, make, model, price, mileage, geography and posting data.
ClassifyMap bikes into manufacturers, families, models and types, then connect them to MSRP and other reference data.
AnalyzeTurn the resulting dataset into an interactive view of market mix, pricing and trends.

The difficult part wasn’t drawing charts. It was making inconsistent human-written listings behave like structured data. I wrote the parser, the classification logic, the supporting model and MSRP data, and the browser-side analytics. One archived working dataset contains more than 5,000 motorcycle listings.

I got pretty far with it. Then somebody else produced a more polished commercial version of essentially the same idea and actually got it to market. Annoying? Absolutely.

But I had already built the data-acquisition, normalization, classification and analytics machinery myself. In retrospect, that’s the part of the project I care about.

Open the original Bikes By The Numbers project →
DISPARATE DATA

What happens when you make unrelated data comparable?

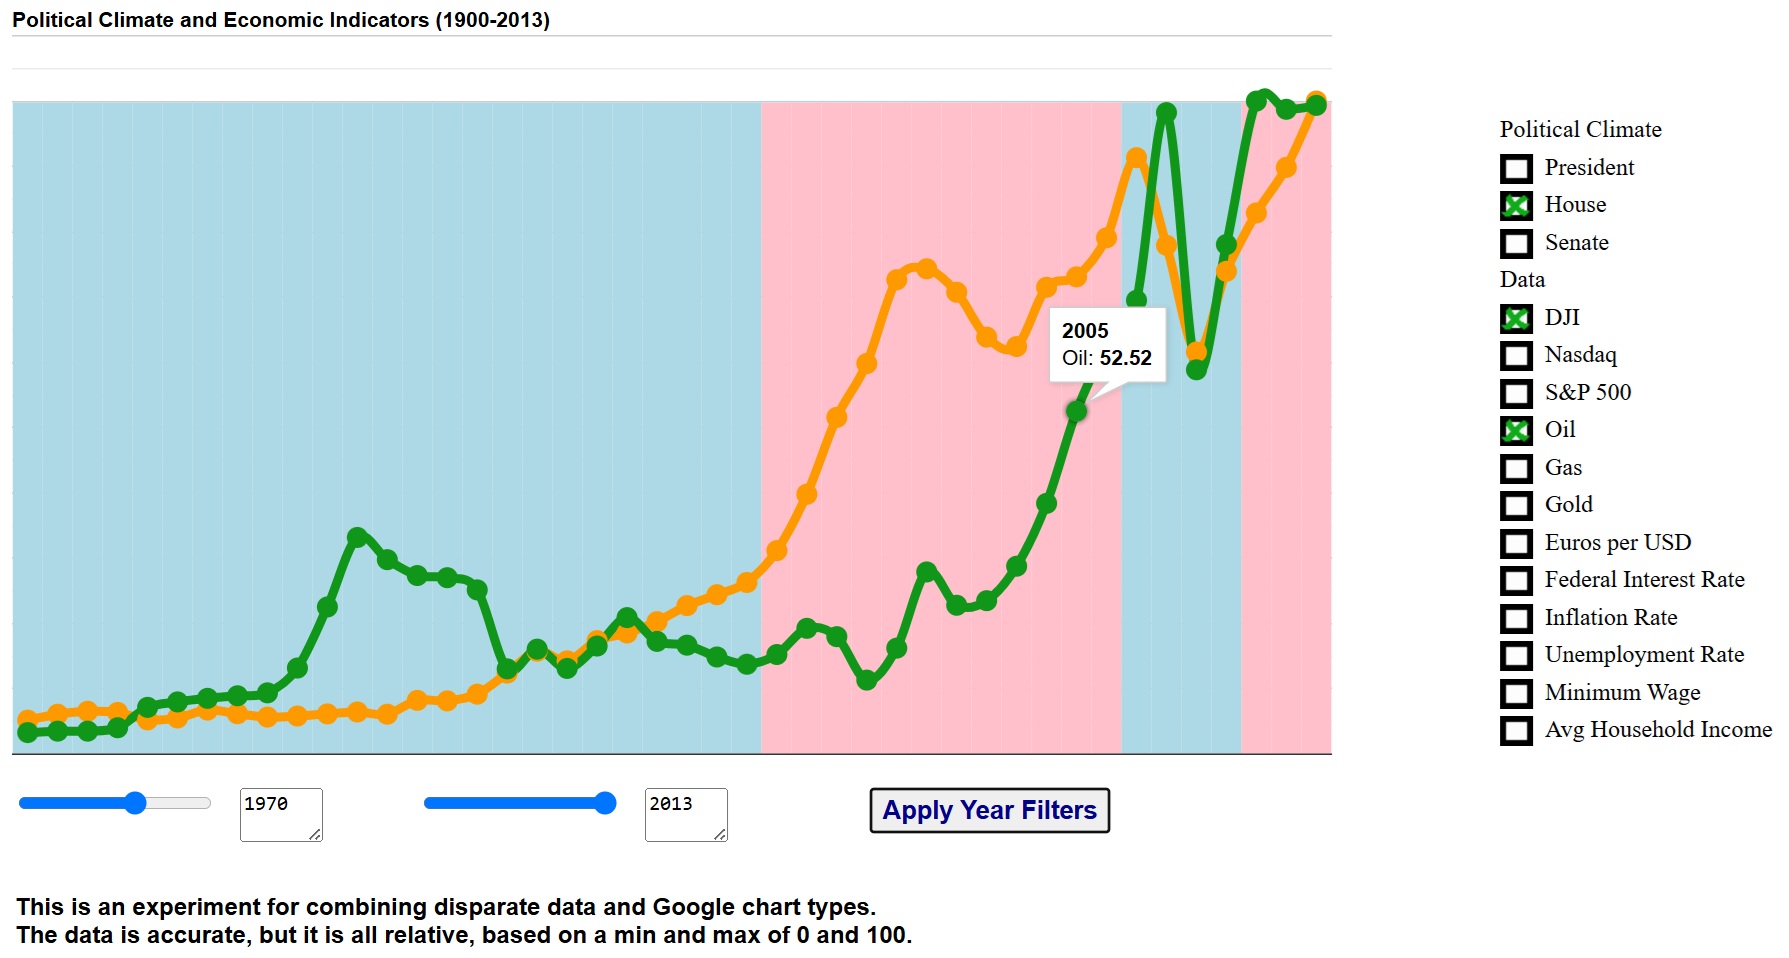
I built this as an experiment in combining data that normally lives in completely different conversations.

Disparate Data political climate and economic indicators interface

Political control of the presidency, House, and Senate. The Dow. Nasdaq. S&P 500. Oil. Gas. Gold. Exchange rates. Interest rates. Inflation. Unemployment. Minimum wage. Household income.

None of those measures share the same units, scales, or ranges, which makes direct comparison basically useless.

So I normalized each series to a common 0–100 relative scale and built an interactive interface that let the user turn individual measures on and off, change the year range, and compare them against shifts in the political climate from 1900 through 2013.

The point wasn’t to prove a political theory.

The point was to see what became visible when radically different datasets could finally be looked at together.

The underlying values remained accurate; only their display scale was normalized so datasets with wildly different units could occupy the same analytical space.

Open the original experiment →
THE EARLY WEB

Fourteen Xeroxed pages were apparently enough.

Sometime around 1997, I taught myself HTML from fourteen photocopied pages of instructions. Then I started using Adobe PageMill because it was easier.

That lasted until I looked closely at the HTML PageMill generated. It was messy and terribly inefficient. So I mostly abandoned the tool and went back to writing the underlying HTML myself.

Use the tool. Look underneath it. If what it’s doing is stupid, take control of the system yourself.

I still have an archive of almost every version of my personal site since then. I’m sorting through the archaeology now.

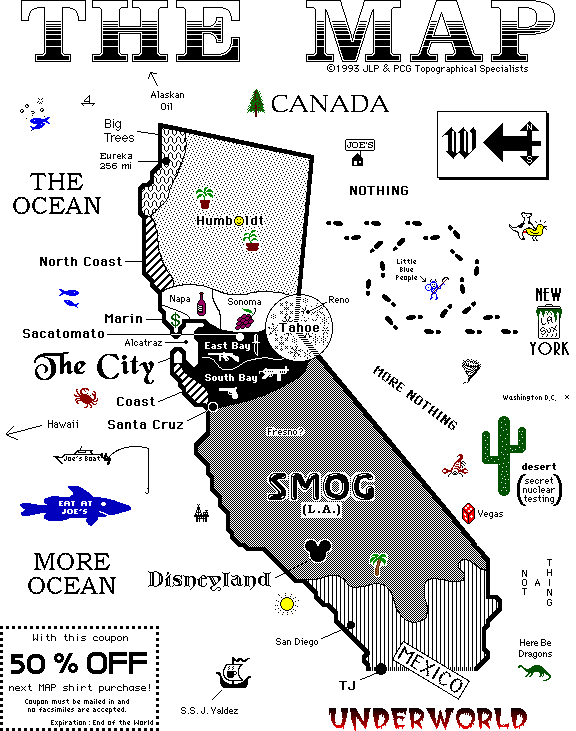
Humorous world map drawn in 1995
This predates the web pages: a deliberately ridiculous world map a friend and I drew in 1995. It eventually ended up on a shirt.
Small animated Ultima III nostalgia graphic
And yes, I made a tiny Ultima III GIF.There is no strategic justification for this. Ultima III was awesome.
LIFELONG GAMER

Started with Pong in 1976. Never really stopped.

Sometime around 1976, my father somehow acquired a prototype Pong machine with no labels on it. I’ve been playing video and computer games ever since—eventually moving from playing them, to wondering how they worked, to programming, and finally to building games and game-development tools of my own.

Apparently I’ve always liked games that give me a world and then let me see what happens inside it.

GAMES THAT STUCK WITH ME · 1976–2018
1976Pong
1980Akalabeth
1981Ultima I
1982Ultima II
1983Ultima III
1985Ultima IV
1987Sid Meier’s Pirates!
1988Ultima V
1989SimCity
1991Civilization
1993SimCity 2000
1996Civilization II
2000The Sims
2001Civilization III
2001Stronghold
2004World of Warcraft
2004GTA: San Andreas
2005Civilization IV
2008GTA IV
2010Civilization V
2010Red Dead Redemption
2013GTA V
2014Elite Dangerous
2015Cities: Skylines
2015Prison Architect
2016Civilization VI
2018Red Dead Redemption 2
2018Red Dead Online
THE PATTERN

The medium changes. The impulse really doesn’t.

Games, analytics, tiny fonts, world generators, restaurant scoring systems, old web pages—the common part is wanting something to behave differently, then getting curious enough to build it.

← Back to the main site